Glove Fit
Designed for fabrication shop workers and quality control personnel engaged in complex assembly fabrication, Glove Systems’s 3D fabrication control platform and laser scanner offer fabricators the ability to provide real-time 3D feedback to fitters and quality team members.
Using Glove System’s platform, fabricators can go beyond physical inspection methods to conduct highly detailed point cloud analysis of as-built assembly to the original design, and through a heat map comparison quickly spot deviations.
Glove Systems platform aggregates all your quality data into one place. Access, share and collaborate on 3D point clouds, photos, videos, and reports using our cloud-based platform
Benefits for fabricators
Go beyond traditional physical inspection methods with powerful 3D measurement. Glove Systems provides real-time, precision feedback to fitters and quality assurance/quality control teams

- Glove Systems seamless integration with the laser scanner is easy to use and enables simple capture and upload of 3D images of the as-built assembly to the Glove Systems platform.
- Comprehensive point cloud analysis compares as-built assembly to the original design.
- Heat map visually highlights deviations and can be adjusted to focus on different parts of the assembly
- Easily share information with project owners for review and verification. The model, 3D digital twin of the assembly, heat map comparison, photos and reports are securely available via the Cloud and can be accessed from any web-enabled browser.
How it Works
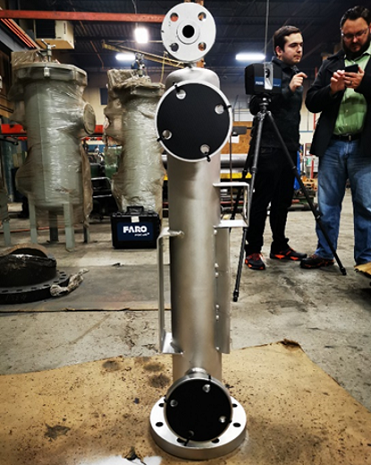
Step 1: Setup Your Assembly
Once an assembly is ready for QA/QC, the craft worker uses the 3D scanner to take several (3 or more for accurate 3D measurement) laser pictures of your assembly.
Step 2: Scan and Match
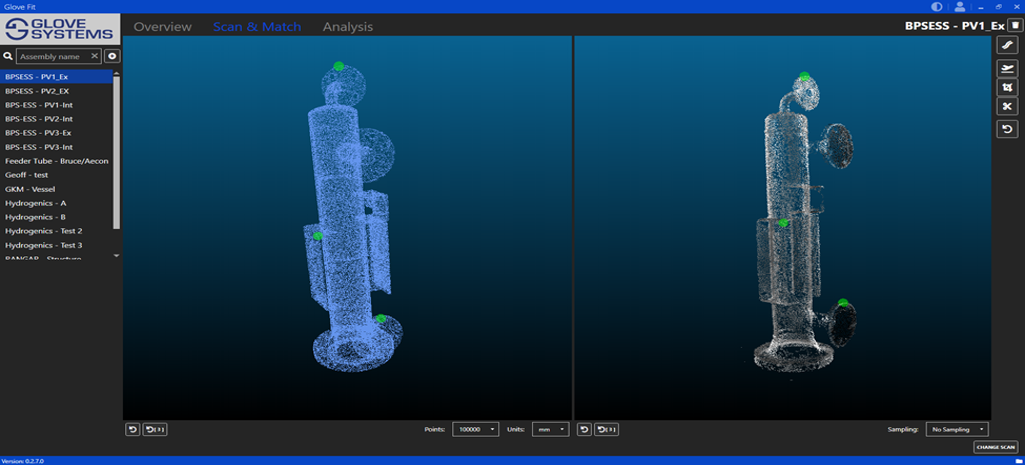
Once the 3D image of the as-built has been acquired, using your 3D model, Glove Systems will overlay the acquired image on the model and provide an analysis.(on the left is the point cloud generated from the design and on the right is the captured point cloud by the laser scanner)
Step 3: Analyze the Overlay
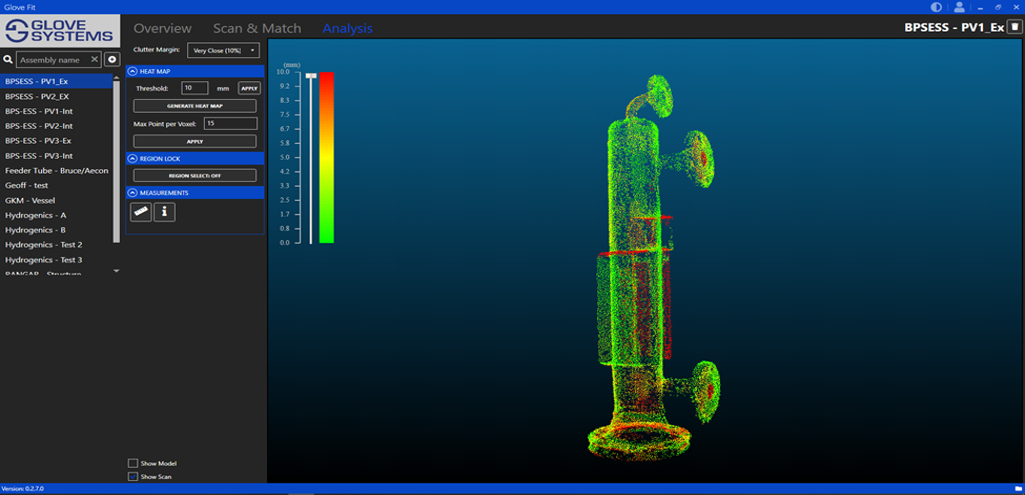
A heatmap indicates dimensional deviations. The tolerance for the heatmap can be set by the user and can be different for different parts of an assembly. A green color indicates compliance with the design tolerance; red areas are indicators of out of tolerance fabrication.
Step 4: Store and Share the Results
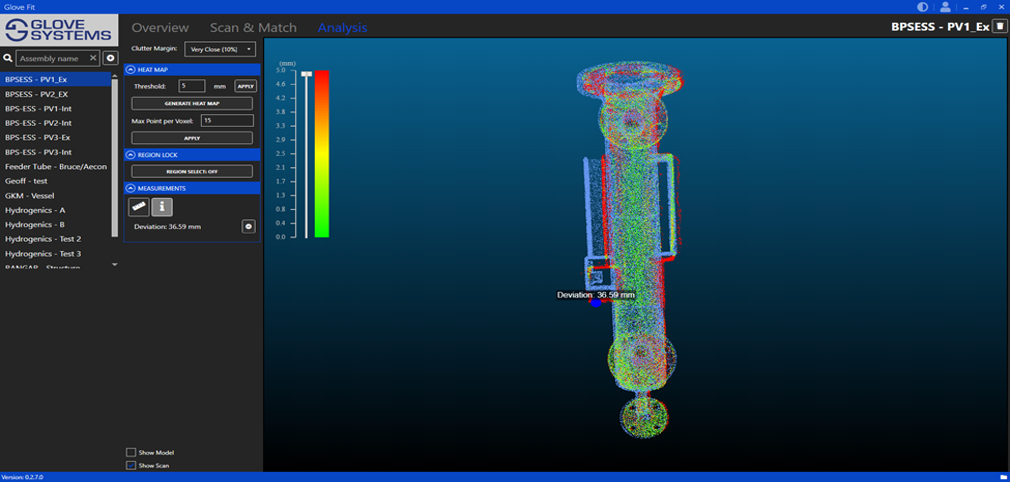
After completing the final analysis, the results (digital twin, scan, and heatmap) are securely stored in the cloud and can be easily shared with other team members and the project owner. The cloud version gives the same functionality (rotation, tolerance adjustment, the measurement between point) as the workstation version
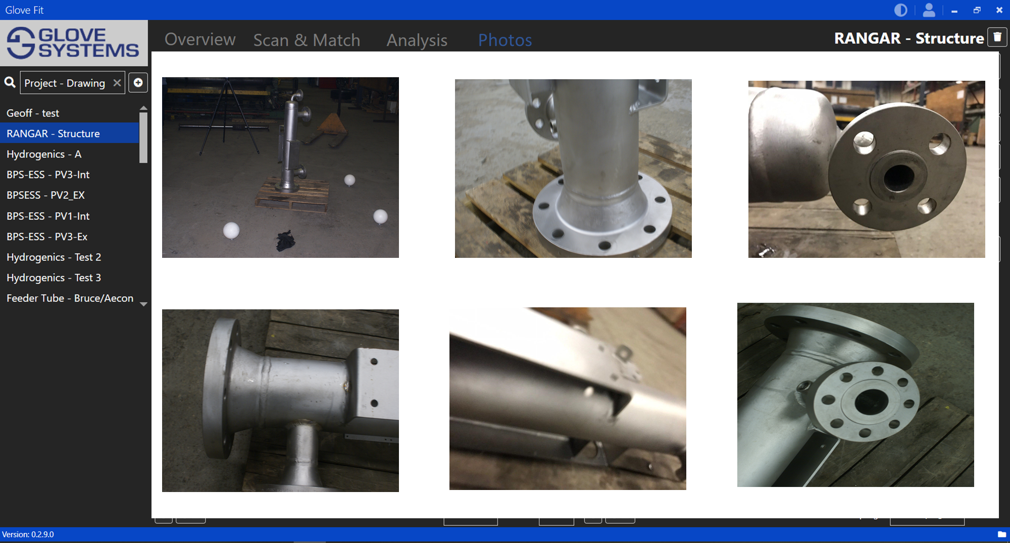
Step 5: Store and share Photos
